


Great report design gets your brand noticed. But it can be super tough to come up with a standout concept (or three). Need creative inspiration? Run through our list of 2026’s top 20 design examples to get your next project off to a great start.
Bland report design fades into the background, but standing out takes more than just good intentions. Enterprise creative teams are often maxed out as they juggle high-volume, high-speed demands, which makes it challenging to deliver stunning reports.
Our recent “Overcommitted” report shows that a staggering 76% of creative teams experienced burnout over the past year. Working on complicated reports often adds to this burden.
From annual reports packed with financials and forecasts to market research and stakeholder surveys, enterprises rely on a wide range of reports to inform decisions, engage investors and showcase results. These projects are business-critical and often complex in nature. Plus, they require accuracy and creativity.
Let’s explore this year’s top 20 report design examples in this showcase designed to spark fresh thinking and inspire your next standout project.
6 key design elements of effective enterprise reports
First, a primer on six crucial considerations for your reports:
20 successful report design examples for 2026 (including annual reports)
Now that you have a clearer idea of what makes a great report, it’s time to bring your next project to life.
These 20 standout reports, handpicked by the Superside team, are sure to inspire new ways of thinking.
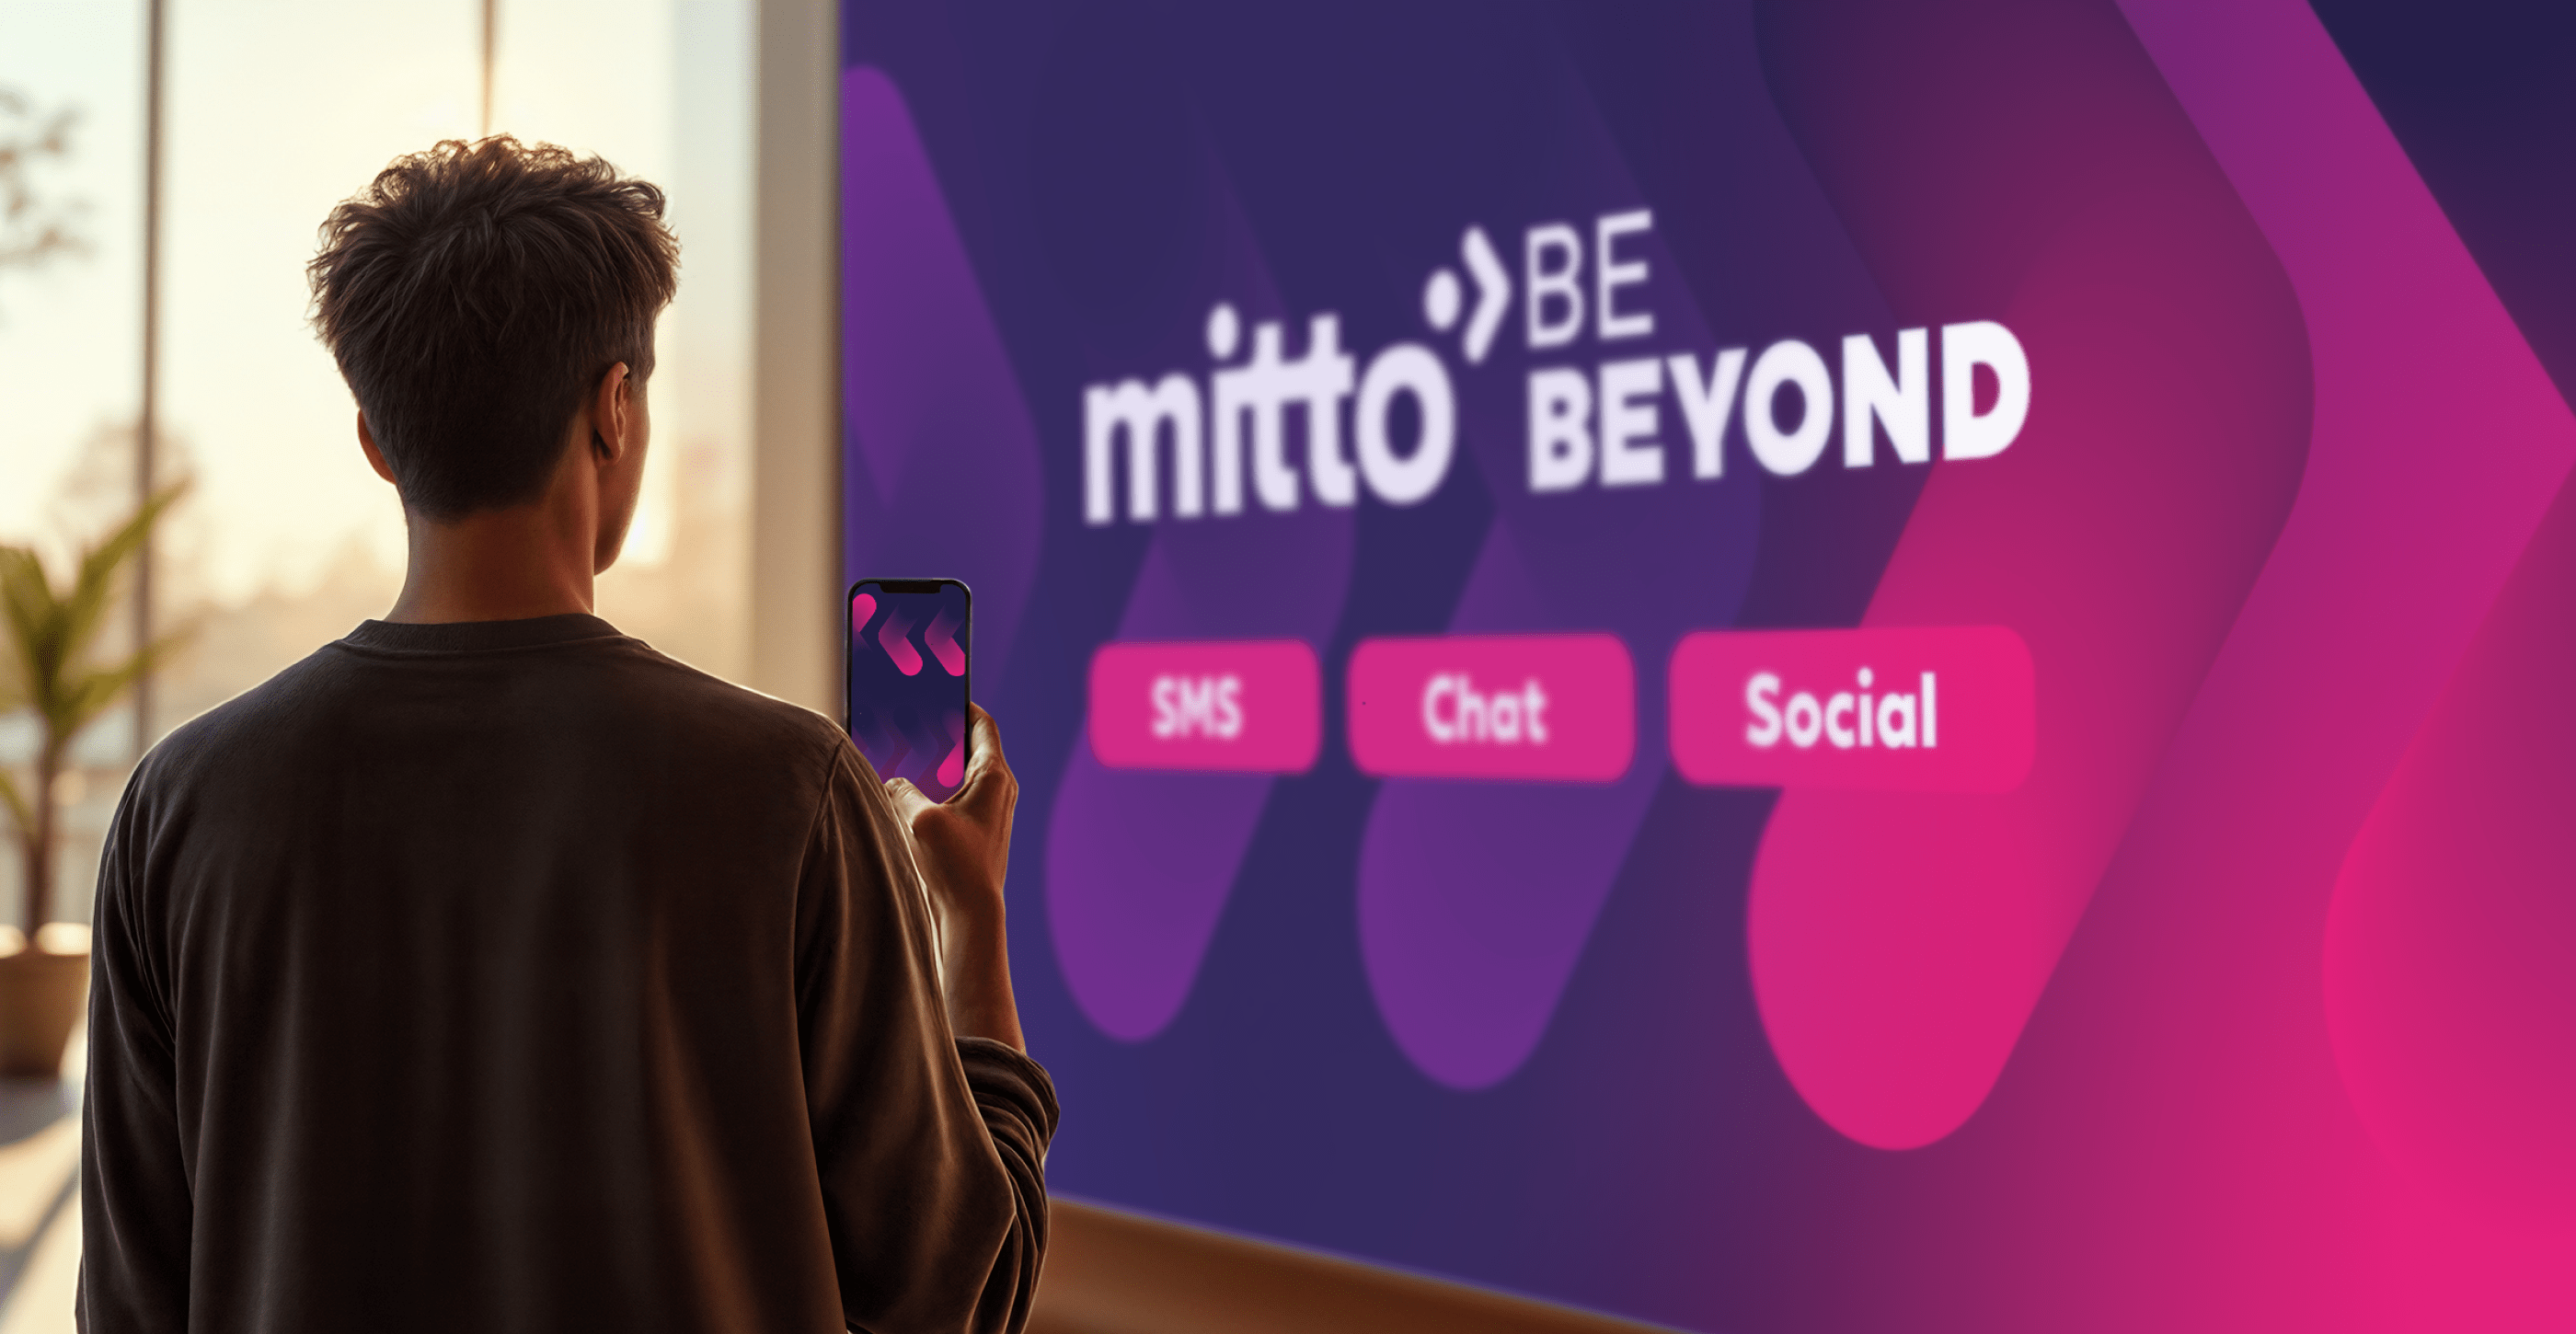
1. ‘Overcommitted’ report by Superside

First on the list is Superside’s own “Overcommitted” report, which epitomizes clean, crisp design. The report incorporates bold colors and clear statistics as a tool to highlight and explain the most relevant findings from our research team in a striking way.
Adding in photos of overwhelmed creatives (think scattered papers, frazzled expressions and a sense of chaos) brings the reality of burnout to life and perfectly complements the report’s sharp, contemporary design. The result is a relatable report that captures the challenges of today’s creative teams.

- Type of report: Research/survey
- Why it works: The combination of engaging narrative, punchy facts and striking photos hook readers from the very first page. Additionally, each section highlights a problem, supports it with data and subtly guides the reader toward a solution.
- Best example of: How to use narrative as a powerful tool to highlight data and create a strong emotional connection with the target audience.

Liked this report a lot? Superside can help you break through the work overload with a scalable, flexible and efficient way to publish high-performing reports without frustration.
Whether you’d like to brainstorm innovative report design ideas or set up new creative templates, our top talent and AI-powered workflows can deliver anything you can imagine.
2. Spotify’s annual ‘Culture Next’ report

(Source: Spotify)
The edgy style of Spotify’s annual deep dive into Gen Z and millennial listening trends has made this report series an ongoing success.
The reports blend sharp images with strong storytelling and use vibrant color blocks, a bold typeface and fluid layouts to create a “comic book” feel that appeals to current and old-school audiences alike.
- Type of report: Trend
- Why it works: Spotify leans all the way into its brand identity here and keeps every section fresh, engaging and playful. Their latest edition is an excellent example of how a brand can use color to separate specific report sections and maintain overall visual cohesion.
- Best example of: How to match report visuals and style with corporate culture and values.
3. IBM’s ‘State of Sustainability Readiness Report 2024’

(Source: IBM)
This report addresses a complex topic: How global enterprises align their technology investments with sustainability goals.
The minimal style puts simplicity and clarity front and center, which makes it a strong example of how to present complex, data-heavy topics in a way that’s easy to digest.
- Type of report: Research/survey
- Why it works: IBM’s report is a masterclass in clarity and accessibility. It blends crisp visual data with a highly readable layout. Statistics are presented in striking black and white, while the pared-back graphic style uses single accent colors and straightforward data points to keep everything clear and easy to interpret. This thoughtful approach makes the report more accessible to readers.
- Best example of: How to simplify complicated information for a general audience.
4. Salesforce’s 2024 Annual Equality Update

(Source: Salesforce)
Salesforce’s annual equality update report is a superb example of how a company can seamlessly weave its brand values into every aspect of its reporting.
The report goes beyond numbers and uses design and storytelling to reflect Salesforce’s deep commitment to equality, transparency and inclusion. These elements make their values visible and actionable for all stakeholders
The report emphasizes storytelling, with a note from the company’s CEO as the introduction. It also incorporates stats that reflect Salesforce’s commitment to equality.
- Type of report: Annual
- Why it works: Quotes, employee stories and people-focused statistics bring a personal touch, making the topic of equality tangible and relatable. Interactive images and straightforward data presentation add clarity and depth. The result is a report that resonates with a wide audience and reinforces Salesforce’s commitment to meaningful change.
- Best example of: How to use storytelling and narrative to enhance data.
5. Pernod Ricard’s ‘BarTrendr’ report by Superside
Superside’s work with Pernod Ricard highlights the difference the right creative partner can make in report design.
The BarTrendr trend report showcases a bold, contemporary layout that strikes the right balance between text and visuals. Generous white space and a modern pastel color palette create a polished, premium feel that aligns seamlessly with the brand’s identity.
It’s also a strong example of how a static asset (once just a flat PDF) can be transformed into a dynamic, fully realized internal magazine. This new format keeps Pernod Ricard’s Marketing and Sales teams engaged and up to date with the latest trends. It also makes the report both more useful and engaging.
- Type of report: Internal communication
- Why it works: For corporate teams tired of reading dull reports, BarTrendr is a great example of how to deliver information in an easily digestible, engaging format. The digital magazine format, which includes a polished, modern design, makes the trend data more engaging and delivers a far more enjoyable reading experience.
- Best example of: How to present information in a way that motivates and engages your readers.
6. Roche’s Annual Report 2024

(Source: Roche)
Healthcare giant Roche’s annual business report is a solid example of how to present intricate information with clarity and purpose.
It covers everything from financial performance to sustainability and innovation and highlights key information with straightforward bar charts and graphics.
The addition of colored micrographs (microscope photos) brings a smart visual touch, which reinforces Roche’s position as a leading health-tech company.
- Type of report: Annual
- Why it works: Straightforward layouts, solid background colors and clear graphs and tables make the information easy to interpret and understand. The report also delivers well-structured business narratives, all of which contribute to a report that’s well-suited to Roche’s shareholder audience. Ultimately, the report’s design helps these stakeholders to make informed decisions.
- Best example of: How to combine critical information and technological advancements with simple, approachable design.
7. Google’s ‘Year in Search 2024’ report

(Source: Google Trends)
Every year, Google’s “Year in Search” report delivers a compelling visual snapshot of what captured the world’s attention. It includes everything from the trends that made headlines to the events and people everyone searched for.
One of the most interesting aspects of the 2024 report is that it offers readers multiple ways to engage with its content. You can watch the video recap, select digital drop-down sections or click on individual topics to search within them.
The report also blends stunning visuals, on-brand fonts, graphs and tables with interactive storytelling to draw attention to key facts and deliver an engaging experience.
- Type of report: Annual
- Why it works: Google’s tailored approach lets readers interact with the data and insights that matter most to them. The design also offers multiple ways to engage with the report’s content. In today’s attention economy, this strategy makes reports more accessible, engaging and user-friendly.
- Best example of: How to take a smart, layered approach to report design to enhance usability.
8. Adidas’s Annual Report 2024

(Source: Adidas)
Adidas is known for innovative marketing strategies and daring design. So it’s not surprising that the brand’s annual report style is colorful, dynamic and immediately engaging.
The digital version opens with a video interview with Adidas CEO, Bjørn Gulden, and then guides viewers through key information using clean, colorful imagery and video backdrops.
The print version is equally impactful and features bold messaging like “You got this” in striking type to capture the reader’s attention from the very first page.
- Type of report: Annual
- Why it works: Adidas’s reporting style and visual approach are a natural fit for the brand’s distinct identity. Financial data is presented with precision, ESG initiatives are thoroughly unpacked and the Adidas message is woven seamlessly throughout every section.
- Best example of: How to make different report formats equally compelling, with strong visuals and consistent messaging across platforms and media.
9. Asana’s ‘The State of Work Innovation’ report

(Source: Asana)
This research report delves into emerging trends and retention strategies in the workplace, as described by over 13,000 employees.
True to Asana’s style, the report features bright, friendly line illustrations and explains every statistic in language that’s both accessible and relatable. This approach makes it a standout example of reporting that aligns perfectly with the company’s straightforward, honest and collaborative identity.
- Type of report: Research/survey
- Why it works: The real strength of Asana’s annual report lies in how authentically it reflects the brand’s identity and the relationships it aims to build with its audience. Every design choice and narrative detail feels intentional. Each modular section features a playful graphic, a concise yet impactful narrative, and facts presented in clear, plain language. These stylistic choices keep the report approachable and easily understood, much like the platform itself.
- Best example of: How to match graphic, font and copy style to the company’s identity and value proposition.
10. Everlane’s Annual Impact Report

(Source: Everlane)
Everlane’s “Annual Impact” report is designed to showcase the company’s commitment to sustainability and ethical practices. The report uses an earth-toned color palette, crisp typography and simple yet evocative imagery of people and the environment to effectively communicate Everlane’s values and progress.
In line with their “radical transparency” approach, Everlane also provides details on how their company operates. They include maps, detailed graphs and clear frameworks to report their sustainability and social impact, all of which reinforces the company’s transparent approach.
- Type of report: Annual sustainability (ESG)
- Why it works: Color choices, images and copy are all carefully calibrated to reinforce the report’s central message: This is a company that cares about sustainability.
- Best example of: How to use thoughtful, on-brand design choices to reinforce and elevate the report’s core message.
11. USAA’s Annual Report to Members

(Source: USAA)
USAA’s annual report stands out as a powerful example of storytelling in financial reporting. Throughout the report, member quotes and personal stories are woven in alongside key statistics, each paired with context that highlights USAA’s ongoing commitment to serving its members.
Bold yellow and blue accents, paired with clean lines and a spacious layout, give the USAA report a bright, open feel that perfectly matches its optimistic messaging.
- Type of report: Annual
- Why it works: Featuring stories and images of real people instantly builds an emotional connection with readers. The use of bright, contrasting colors and on-brand fonts further enhances the mood, which sets a positive and inviting tone throughout the report.
- Best example of: How to use real-world storytelling to reinforce brand messages.
12. Oyster’s ‘Guide to Hiring Global Talent’ by Superside
Oyster set out to create an in-depth guide to hiring international talent and turned to Superside for creative support.
Through close collaboration (we shared references, explored creative options and refined the preferred direction), Oyster and Superside developed an engaging, human-centered report brought to life with unique illustrations.
The finished guide features bright, approachable graphics and organic colors that reflect Oyster’s commitment to DEI, joyfulness and celebrating diverse human experiences. Ultimately, it’s a resource that’s as visually inviting as it is informative.
- Type of report: eBook, guide
- Why it works: Playful layouts, vibrant colors, pastel graphs and thoughtfully selected typefaces make Oyster's guide a refreshing departure from typical corporate eBooks. These design choices also perfectly capture the brand’s innovative spirit and commitment to championing diversity.
- Best example of: How to use a light, playful design approach to support serious data and ideals.
13. Subaru’s 2024 Integrated Report

(Source: Subaru)
Subaru’s annual reports are packed with detailed statistics, yet they remain accessible and easy for any reader to understand. This is a notable achievement, given the complexity of the information presented.
The latest iteration features a cool blue color palette, well-designed technical graphics and cleanly laid-out graphs to illustrate key numbers.
The Subaru slogan “Delivering happiness to all,” paired with thoughtfully chosen customer quotes and photos, brings a genuine human element to the report. This makes it stand out and resonate on a personal level.
- Type of report: Annual
- Why it works: Every page in this report conveys a strong sense of authority, innovation, care and expertise, qualities you’d expect from a leading automotive brand.
- Best example of: How to present technical information in a way that doesn’t overwhelm the reader.
14. Semrush’s ‘Think Big with AI’ report

(Source: Semrush)
Semrush’s recent “Think Big with AI” report is a strong example of how to combine a trending topic with great design. Each page uses minimalist layout principles with attractive jewel tones to emphasize the most important points and graphics.
Including a link to Semrush’s AI assistant adds a smart layer of interactivity, allows readers to ask questions directly and reinforces the report’s “AI-first” approach.
- Type of report: Research/survey
- Why it works: This document uses striking colors, a well-organized layout and straightforward text to make a complex topic more accessible. Key graphics are given their own pages, which helps them stand out.
- Best example of: How to deliver thought leadership in a digestible, well-designed package.
15. TotalEnergies’ Sustainability & Climate 2024 Progress Report

(Source: TotalEnergies)
TotalEnergies’ 2024 sustainability report is packed with charts and the kind of hard-hitting scientific data that could leave the average reader scratching their head in confusion.
Thanks to the way this complex information is organized, readers can quickly grasp the data. Bright color choices, on-brand fonts and consistent use of the TotalEnergies palette throughout every graphic make the report even more approachable.
- Type of report: Annual sustainability (ESG)
- Why it works: Everything from the line charts to the headings incorporates TotalEnergies’ friendly color scheme. It’s all laid out in a crystal-clear hierarchy that guides readers to the most important information. This choice makes what could have been a totally inaccessible report far more understandable.
- Best example of: How to use brand colors to make dense information approachable and legible to any reader.
16. BMW Group’s annual report

(Source: BMW Group)
BMW’s 2024 annual report opens with an immersive video experience that puts readers right in the driver’s seat of the year’s most iconic cars. The report continues as a fully interactive digital journey, which features clickable graphs, maps and sleek photography that invite readers to look at additional resources.
If you need inspiration for your next digital report, this professional design is well worth exploring.
- Type of report: Annual
- Why it works: The report’s futuristic design and interactive features immediately draw readers in. Thanks to seamless navigation and thoughtful UX, this report feels as smooth and sophisticated as driving a luxury car. The process is effortless and engaging from start to finish.
- Best example of: Digital report design that’s on-brand, intuitive and genuinely enjoyable to interact with.
17. LC Packaging’s 2024 Sustainability Report

(Source: LC Packaging)
LC Packaging’s sustainability report is an excellent example of how a straightforward design can still make a strong impact. The report uses simple graphics, easy-to-read graphs and accessible language to highlight the company’s sustainability achievements.
Combined with a clean, no-frills layout, these design choices make it easy for readers to quickly find key insights and clearly understand LC Packaging’s core ESG messages.
- Type of report: Sustainability (ESG)
- Why it works: LC Packaging’s informative, no-fuss approach to sustainability reporting matches the topic and keeps the reader focused on what’s important: The company’s ESG success.
- Best example of: How to use simple, professional design to spotlight key information.
18. FIFA’s Annual Report 2024

(Source: FIFA)
FIFA’s latest annual report masterfully breaks down large amounts of information into easily digestible sections.
The digital report features clearly organized areas (e.g., governance, financials and upcoming events), making it simple for readers to see the topics and results most relevant to them.
The document incorporates looped video backgrounds and dynamic sports imagery to guide readers from section to section—a fitting, on-brand touch for an organization centered on action and excitement. These creative choices help the report stand out as one of the year’s strongest examples.
- Type of report: Annual
- Why it works: FIFA’s report design and image selection are bold, engaging, stylish and full of emotion. These elements all help capture the attention of sports fans and industry professionals.
- Best example of: How to use video backdrops and “action” imagery to keep readers engaged.
19. Upstack’s 2024 Technology Trends Report

(Source: Upstack)
Upstack’s latest tech trends report is an inspiring example of thought leadership done right.
The professional-looking report includes detailed quotes from business intelligence industry leaders, who explain the importance of each trend and highlight the most crucial facts that business leaders need to know.
Each trend is also illustrated with a similar color-coded, stacked bar chart. These charts make it easy to compare data across topics.
- Type of report: Trends
- Why it works: Using a consistent layout for each trend, featuring quotes, charts and extra insights, is a smart design move. It creates a structure that readers can easily follow, which ultimately makes the report’s complex data insights more accessible.
- Best example of: How to present thought leadership content in an accessible format for easy reading.
20. Nestlé’s Annual Review 2024

(Source: Nestlé)
Nestlé’s latest annual review meets a crucial design goal: It looks just as good online as on paper. Both versions use warm imagery and plain language to communicate the company’s values and its commitment to nutrition, health and wellness.
Throughout the report, Nestlé uses smaller case studies to highlight specific products and statistics. This approach makes it more likely that a reader skimming the report will find an example that catches their attention.
- Type of report: Annual
- Why it works: Nestlé’s layouts and color choices are simple, sophisticated and professional. Their design choices, such as creating a digital video montage from the same images used in the print version, make it easy to adapt content for various formats and platforms.
- Best example of: A simple but appealing report design that works across multiple contexts.
How Superside makes report design faster, smarter and more affordable
You don’t have to tackle report design on your own. Superside can act as a seamless extension of your in-house team, adapt to your brand and help you deliver a standout end result.
With Superside as your creative partner, you get more ideas, more support and top-quality results faster, for less and without the usual agency headaches.
Our dedicated, globally distributed team has the expertise to transform any document into a compelling, on-brand masterpiece, helping your enterprise stand out and leave a lasting impression.
The best part? We can deliver just about any creative asset you can imagine, from eBooks, whitepapers and reports to brochures and pitch decks. Superside’s flexible, annual subscription gives you access to whatever capabilities you need. The list includes:
- Graphic design services
- Brand design
- AI creative and AI consulting services
- Video production and motion design services
- Illustration design
- Web design and Webflow development
- Social media and ad creative
- Email design
- Print design services
- Packaging and merch design
- Digital marketing strategy & consulting
- Presentation design and concept creation
- Design systems and product design services
- Immersive design services for AR / 3D solutions
- eBook and digital report design and copywriting services
With simple, customizable pricing and no hidden fees, you can scale as needed, without the pain of constant contract or per-project negotiations.
Make Superside your top creative team for reporting design
Need professional business reports, a strong visual identity or an out-of-the-box branding strategy? Superside can get it done faster, without any of the friction you’d expect from working with traditional agencies or freelancers.
As the world’s leading AI-powered creative service provider, we’ll help you communicate your ideas efficiently, produce reports and other creative that pull customers in, and help you maintain brand integrity across every touchpoint.
FAQs
This is the quality you can create with Superside
Discover how Supersiders help global brands
launch high-impact campaigns at scale with top design.
We're your creative team's creative team.


Top design capabilities
Explore Superside's full range of design capabilities
with creative examples of our work for clients,
like Amazon, Notion and Reddit.


The creative partner of the future
82% of in-house teams can't keep up with creative requests.
100% have found relief with Superside.
With AI-powered workflows, certified creatives and 5x faster turnaround times, your enterprise teams can be next.