

Tell richer stories with illustration design
From expressive characters to artful infographics, our experts create custom illustrations to give your content a visual voice that’s uniquely yours. Any style. Any complexity.
Book a demo with our experts
 Storyboarding
Original artwork for when generic stock doesn't cut it
Your unique brand deserves ownable, brand-building visuals to match.
Through rich detail and intentional craft, our illustration experts bring your brand’s story to life. Every stroke, shape, and symbol is designed to add meaning and leave a lasting impression.
Over 7,000 illustration projects delivered
From sets of custom icons to office-wall murals, no matter the scale, we deliver work that is original, captivating, and narrative-driven.
Brand illustrations
Original artworks for any channel that reflect your brand’s voice and values.


Iconography
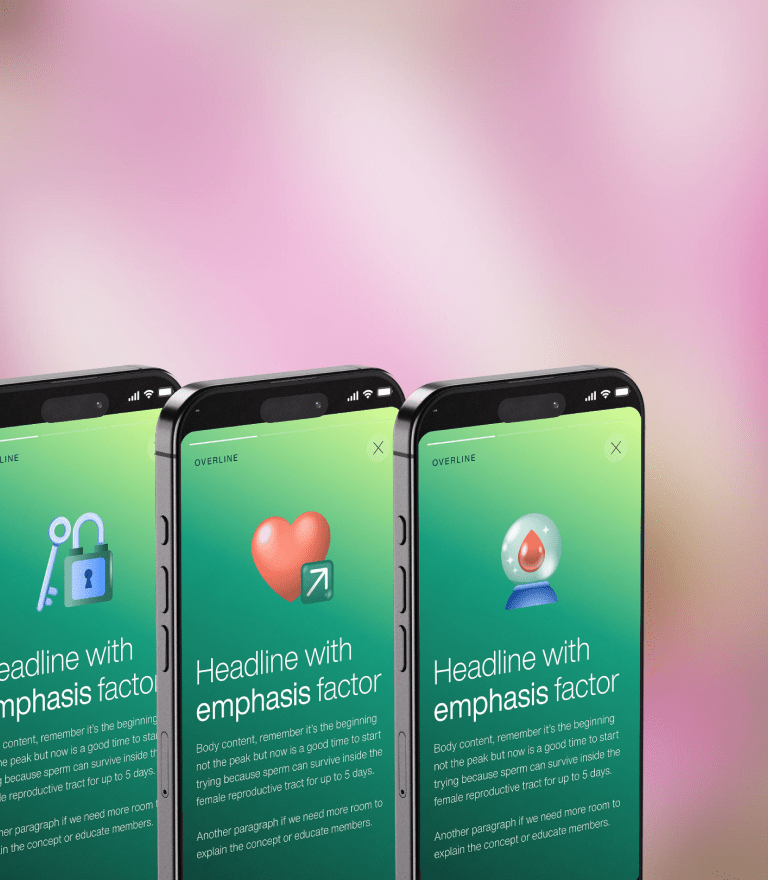
Cohesive icon sets that add clarity and polish.


Data visualization
Illustration design that transforms complex information into clear, compelling visual stories.


Storyboarding
Visual blueprints that help shape and get buy-in for your big idea.


Infographic design
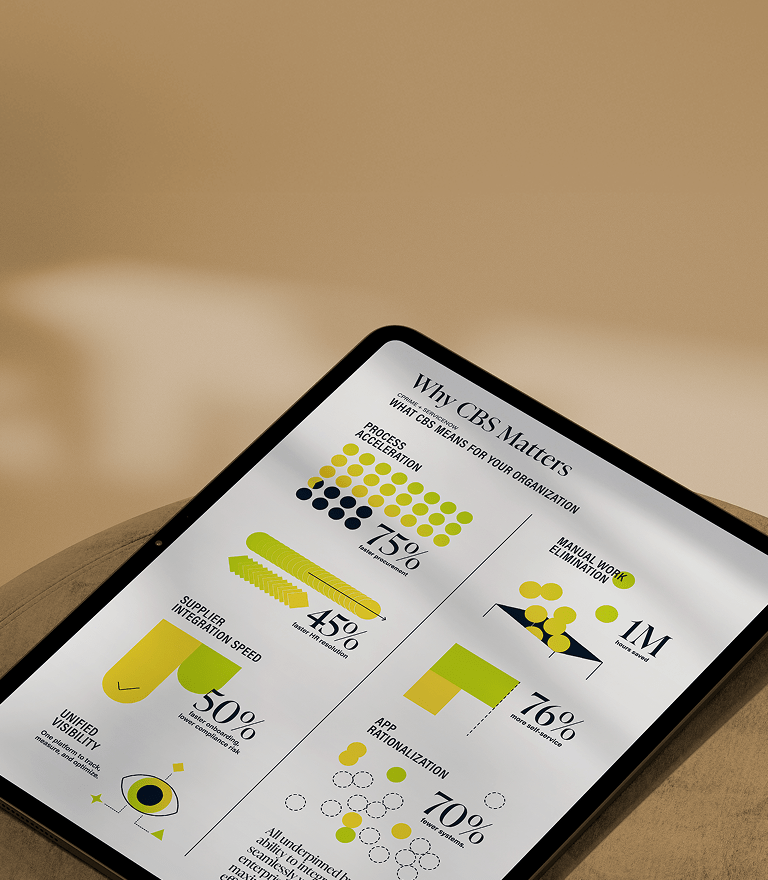
Thoughtfully composed to make your data clear, memorable, and shareable.
Character design
Expressive brand characters that add personality and story to any campaign.
Bringing brand personality to every platform
From digital platforms to physical spaces, we make sure your brand shows up clearly and consistently.
Web & product
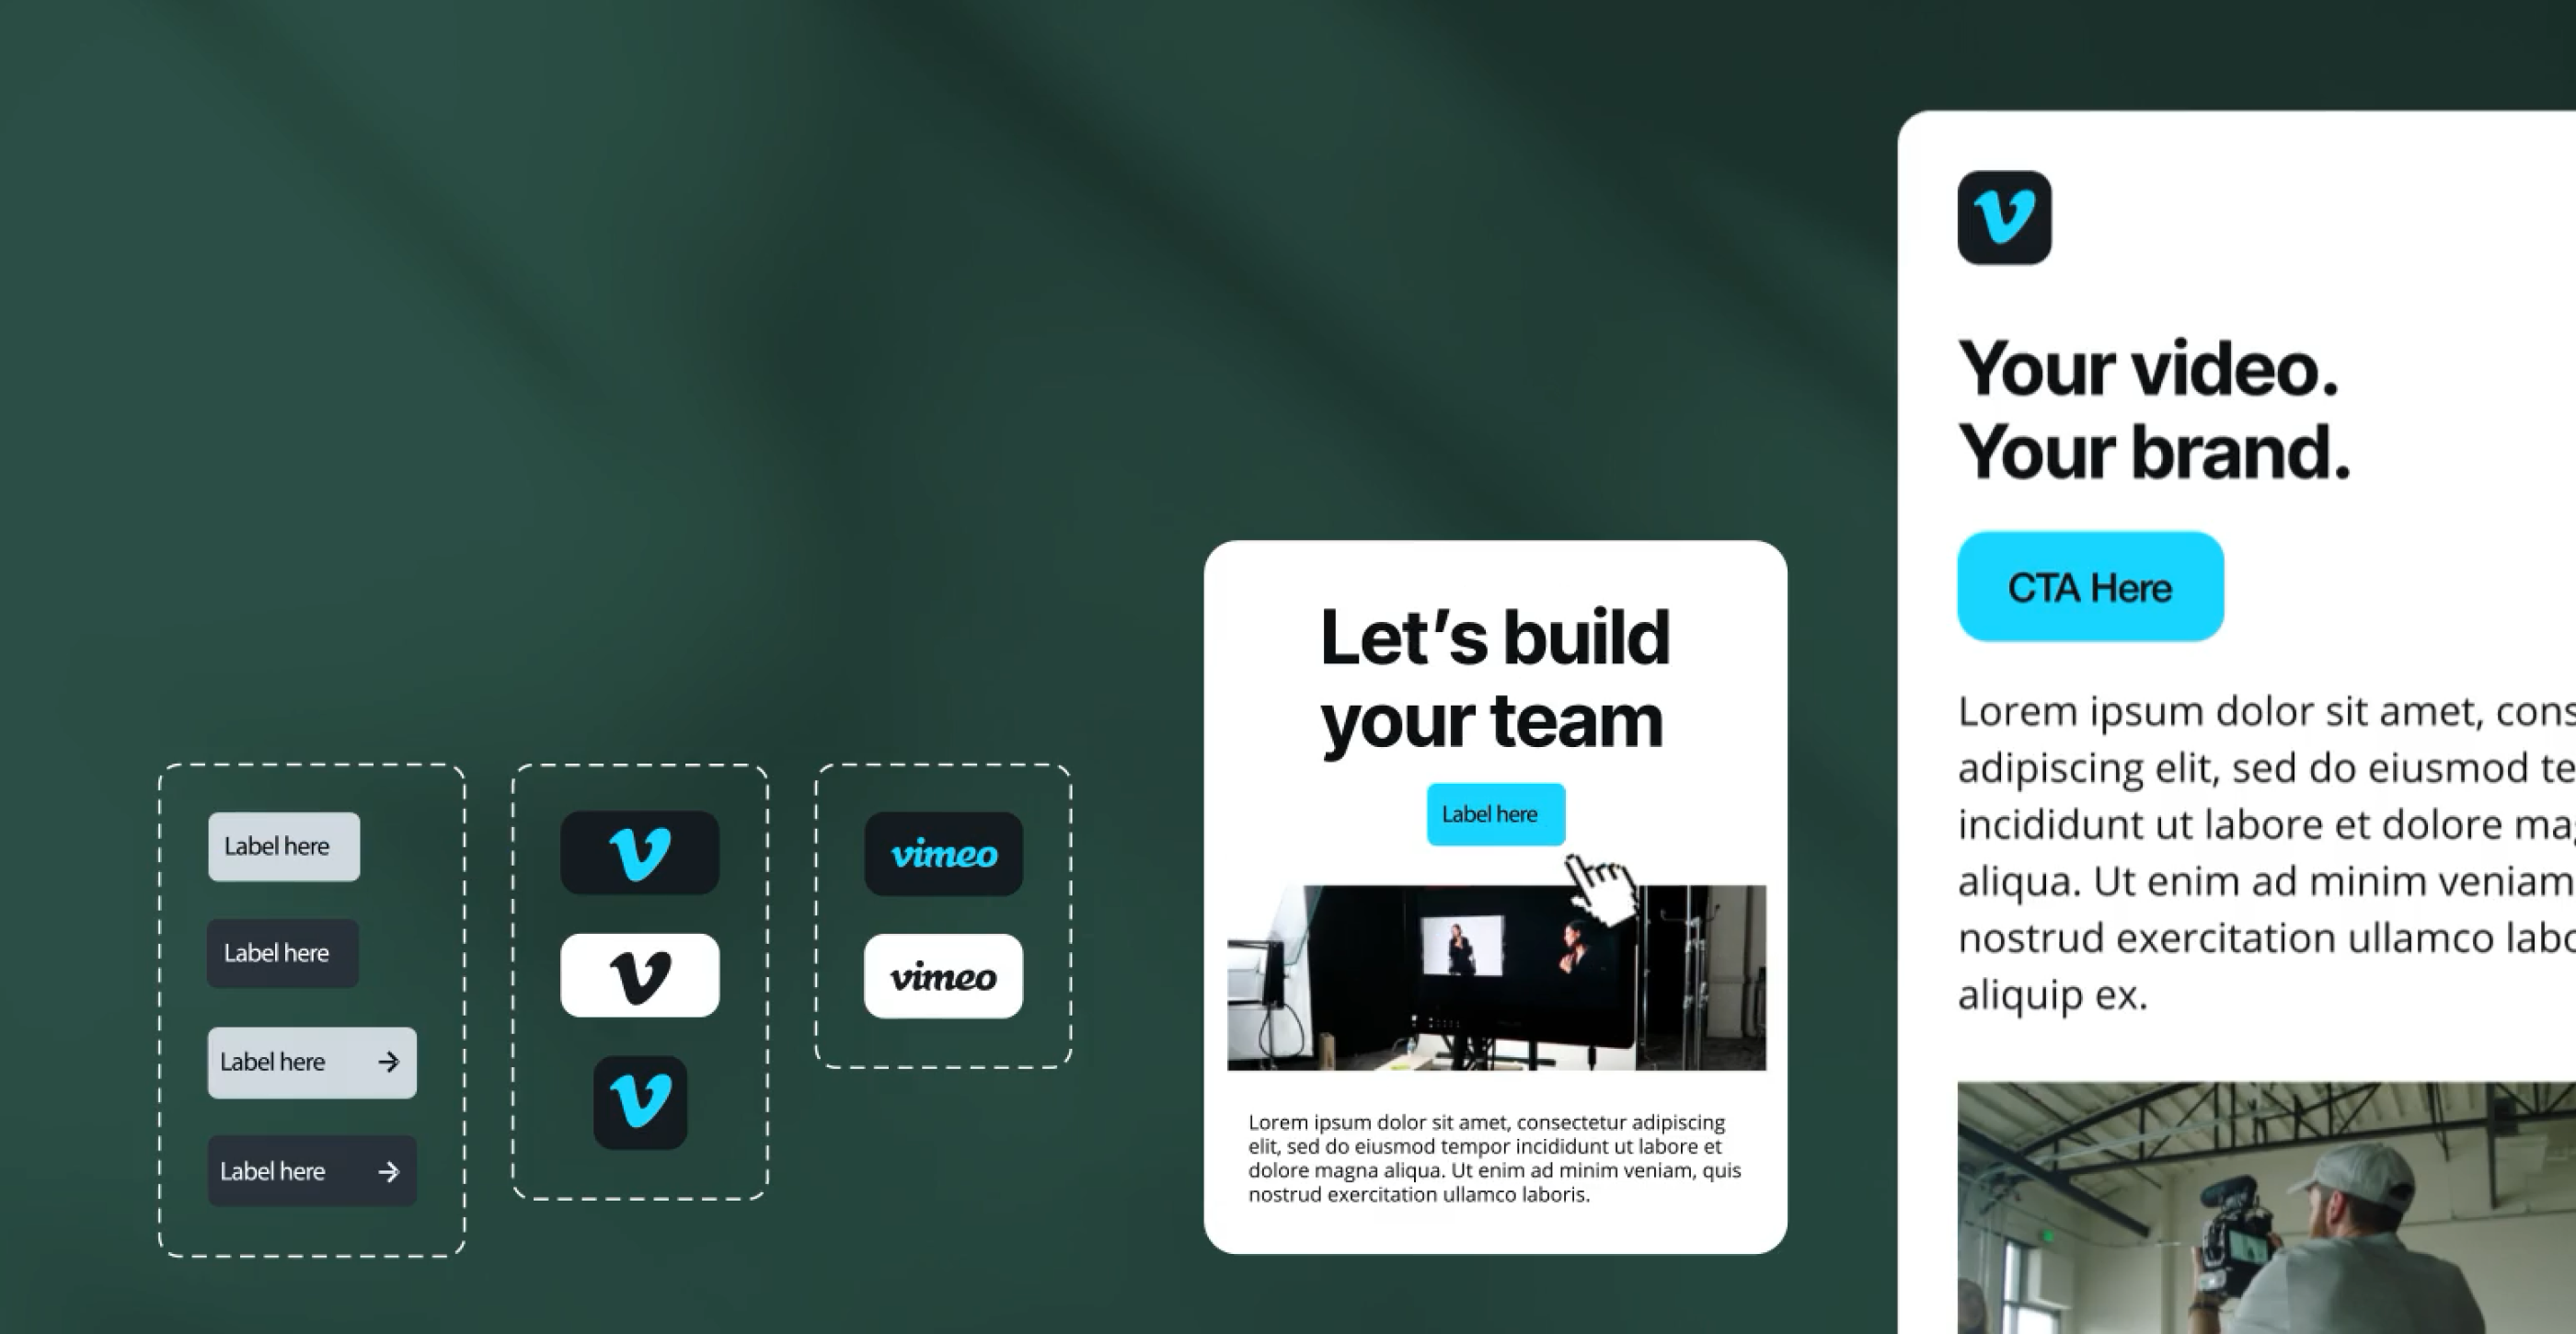
Bring your digital experiences to life with illustrations that guide, delight, and convert.
Social
Stop the scroll with standout visuals built for engagement and brand recognition.
Sales & marketing
Support your message with custom illustrations that clarify and persuade.
Reports & editorial
Make long-form content more compelling with visuals that enhance clarity and credibility.
Events & activations
Draw attention and drive connection with design tailored for booths, signage, and giveaways.
Infographics
Transform complexity into clarity with visuals that simplify, structure, and stick.
Smarter illustration
at scale
We use AI to support faster production while keeping creative control in human hands.
Speed up early-stage creative exploration
Expand your illustration library and get multiple variants, fast
Generate on-brand illustrations with models trained on your visual identity
Book a demo with our experts


From first sketch
to final file
We streamline the process from idea to execution so you get on-brand, high-impact visuals without the back-and-forth.
Briefing
We start with your goals, audience, formats, and inspiration to set the creative direction.
Concepting
Our illustrators explore early styles or ideas, ensuring alignment with your brand and brief.
Review
You’ll review initial sketches or drafts, giving feedback to refine tone, clarity, and fit.
Design
Once approved, we polish and produce the final illustrations in full fidelity.
Delivery
Final files, across every needed format, are shared in one organized, easy-to-access space.
Now imagine this creative power behind your next project
This is just one of many creative services—what you do with them is up to you. Let's chat.
Book a demo with our experts


Read more about illustration design for creative teams


Top 13 Illustration Agencies & Studios for Creative Solutions in 2026
Illustration design can be a powerful visual solution to your next campaign challenge, bringing standout color, character and life to your creatives. The power of illustration is also what makes it so challenging. The choices of style, color, texture and viewpoint are endless, which could leave you feeling overwhelmed. Every chosen element should also align with your brand’s identity—a tough ask.
Why You Haven’t Experimented With Illustration in Your Marketing and How to Get Started
A picture is worth a thousand words—if done right. Illustrations articulate the gaps that copy reveals, they liven up a bland landing page and stop scrollers in their tracks.Your illustration design questions, answered
Yes, every Superside subscription covers illustration design services, in addition to other design capabilities like web design, print design and more. Each of our pricing tiers offers credits to bring your illustration design projects to life, guaranteeing that you can achieve your creative objectives efficiently, regardless of the subscription level you choose.
At Superside, we specialize in delivering more than just illustrations—we provide on-brand graphical illustrations, captivating infographics, and insightful data visualizations meticulously crafted to elevate every aspect of your business presence. Whether you're enhancing your website, enriching sales collateral, refining reports, or elevating presentations, we're equipped to transform your ideas into stunning visuals that resonate with your audience. With our dedicated team of experts, anything your business needs illustrated, Superside can not only do but exceed expectations, ensuring your brand stands out in a crowded market landscape.
Our illustration design services are the go-to choice for marketing and creative teams at scale-ups and enterprises. By leveraging our talented designers, your in-house team can reclaim precious time, confident that our illustrations will consistently reflect your brand's essence. Our collaborative platform streamlines the entire process—from initial briefings to feedback, revisions and secure storage of brand assets—ensuring seamless communication and alignment every step of the way.
At Superside, we pride ourselves on sourcing top-tier talent globally, handpicking only the top 1% of designers to join our team. Our illustration services cover a wide spectrum, ranging from elegant background designs to intricate, fully realized characters. All of this creativity is managed through our cutting-edge, collaboration-driven platform, facilitating direct communication between your Superside creative team and your enterprise's team. This ensures that our illustrations consistently align with your brief, reflect your brand identity impeccably and are delivered punctually, without fail. With Superside, you can trust that your visual needs are on brief, on-brand, and on time, every time.
Illustration design is the art of creating visual representations or images that convey a specific message, idea, or concept. It involves using various techniques, such as drawing, painting, or digital illustration, to communicate visually in a wide range of contexts, including advertising, editorial content, branding and storytelling. At Superside, we use illustrations to enhance and complement written content, evoke emotions, clarify complex ideas or simply add visual interest to a piece of work.
Infographic design is the process of creating visually compelling graphics that present complex information, data, or concepts in a clear and concise way. Infographics combine text, images and graphics to convey information quickly and effectively. Some examples of infographics that you may be familiar with include pie charts, bar graphs, diagrams, mindmaps and much more. Superside’s approach to illustration design involves strategic layout, color choices, typography and graphic elements to ensure that information is easily understandable and visually appealing to the audience.
The key difference between an illustrator and a graphic designer lies in their primary focus and skill set. An illustrator specializes in creating hand-drawn or digitally rendered images, often with a strong emphasis on artistic expression and storytelling. Their work is focused on producing visually engaging illustrations that communicate ideas, concepts, or narratives. On the other hand, a graphic designer focuses on visual communication and problem-solving, using typography, imagery, color and layout to create designs for various purposes, such as branding, advertising and user interface design. Illustrators usually concentrate on making unique artworks, whereas graphic designers prioritize crafting functional and visually appealing designs tailored to specific goals and target audiences. Fortunately, at Superside, we have access to the top 1% of global talent, so we're able to offer both approaches in a single subscription service.


